Objective
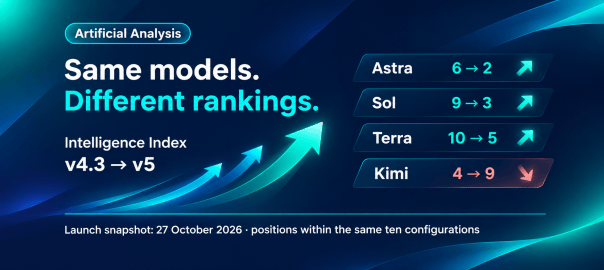
Artificial Analysis is one of my go-to sites for comparing AI models. When its Intelligence Index moved from v4.3 to v5, some of the same models appeared in different positions. I wanted to understand what changed in the measurement, what those ranking changes tell us, and how to use the results when choosing a model.
This post accompanies my video walkthrough and adds the details I left out of the narration. The comparison is a launch snapshot from October 27, 2026, not a current leaderboard. I analyzed published results; I did not rerun these benchmarks myself.
What Changed In Version 5
The Intelligence Index combines nine evaluations into four equally weighted categories. Each category contributes 25%, although the individual benchmarks within it have different weights.
The v5 mix is:
| Category | Benchmarks And Index Weights |
|---|---|
| Knowledge Work — 25% | AA-Briefcase 15%, AutomationBench-AA 5%, GDP.pdf 5% |
| Coding — 25% | FrontierCode 2.0 15%, Terminal-Bench 4.0 10% |
| Science — 25% | Terminal-Bench-Science 15%, CritPt v2 hard subset 10% |
| General — 25% | AA-Omniscience v1.1 15%, HLE-Diamond 10% |
Version 5 adds FrontierCode 2.0 and Terminal-Bench-Science, removes GDPval-AA, SciCode, and AA-LCR, and upgrades several retained evaluations. HLE becomes HLE-Diamond, with 1,000 questions. CritPt uses a private 40-question hard subset. GDP.pdf’s weight falls from 10% to 5%.
The category balance changes too: Knowledge Work and General move from 30% to 25%, while Coding and Science move from 20% to 25%. GDP.pdf moves into Knowledge Work, and HLE moves into General. These are simultaneous changes, so a difference in a model’s aggregate score cannot be attributed to one of them without further analysis. Artificial Analysis’s v5 announcement describes the changes.
What A Benchmark Score Depends On
A benchmark starts with a curated test set. Its tasks need reference answers, executable checks, or defined grading criteria. The model attempts the tasks under specified conditions, and its work is scored.
Three useful distinctions are:
- Programmatic checks: automated scripts verify an outcome, such as whether code passes tests or a system reaches the required state.
- LLM checks against a reference answer: a judge compares the response with a trusted answer, allowing different wording.
- LLM rubric judgments: a judge applies criteria such as correctness, completeness, or presentation quality.
A benchmark can combine methods. LLM grading does not necessarily mean a subjective preference judgment, and a rubric can assess correctness as well as presentation.
The harness matters alongside the grader. It supplies the prompts, tools, environment, and execution limits around the model. Artificial Analysis documents Stirrup for several evaluations, mini-swe-agent for the terminal suites, and single-turn, no-tool setups for GDP.pdf and HLE-Diamond. The benchmarking methodology describes the conditions for each evaluation.
Comparing models under a consistent setup differs from comparing complete agents. In the latter case, the model and the orchestration around it both contribute to the result.
Evaluation tooling is another role: managing trials, running checks, and reviewing results. The roles can overlap within a framework. For example, Artificial Analysis documents Harbor’s analyze command for Terminal-Bench integrity review in its Coding Agent Index methodology. That specific usage does not establish that Harbor runs the entire Intelligence Index.
Same Models, Different Rankings
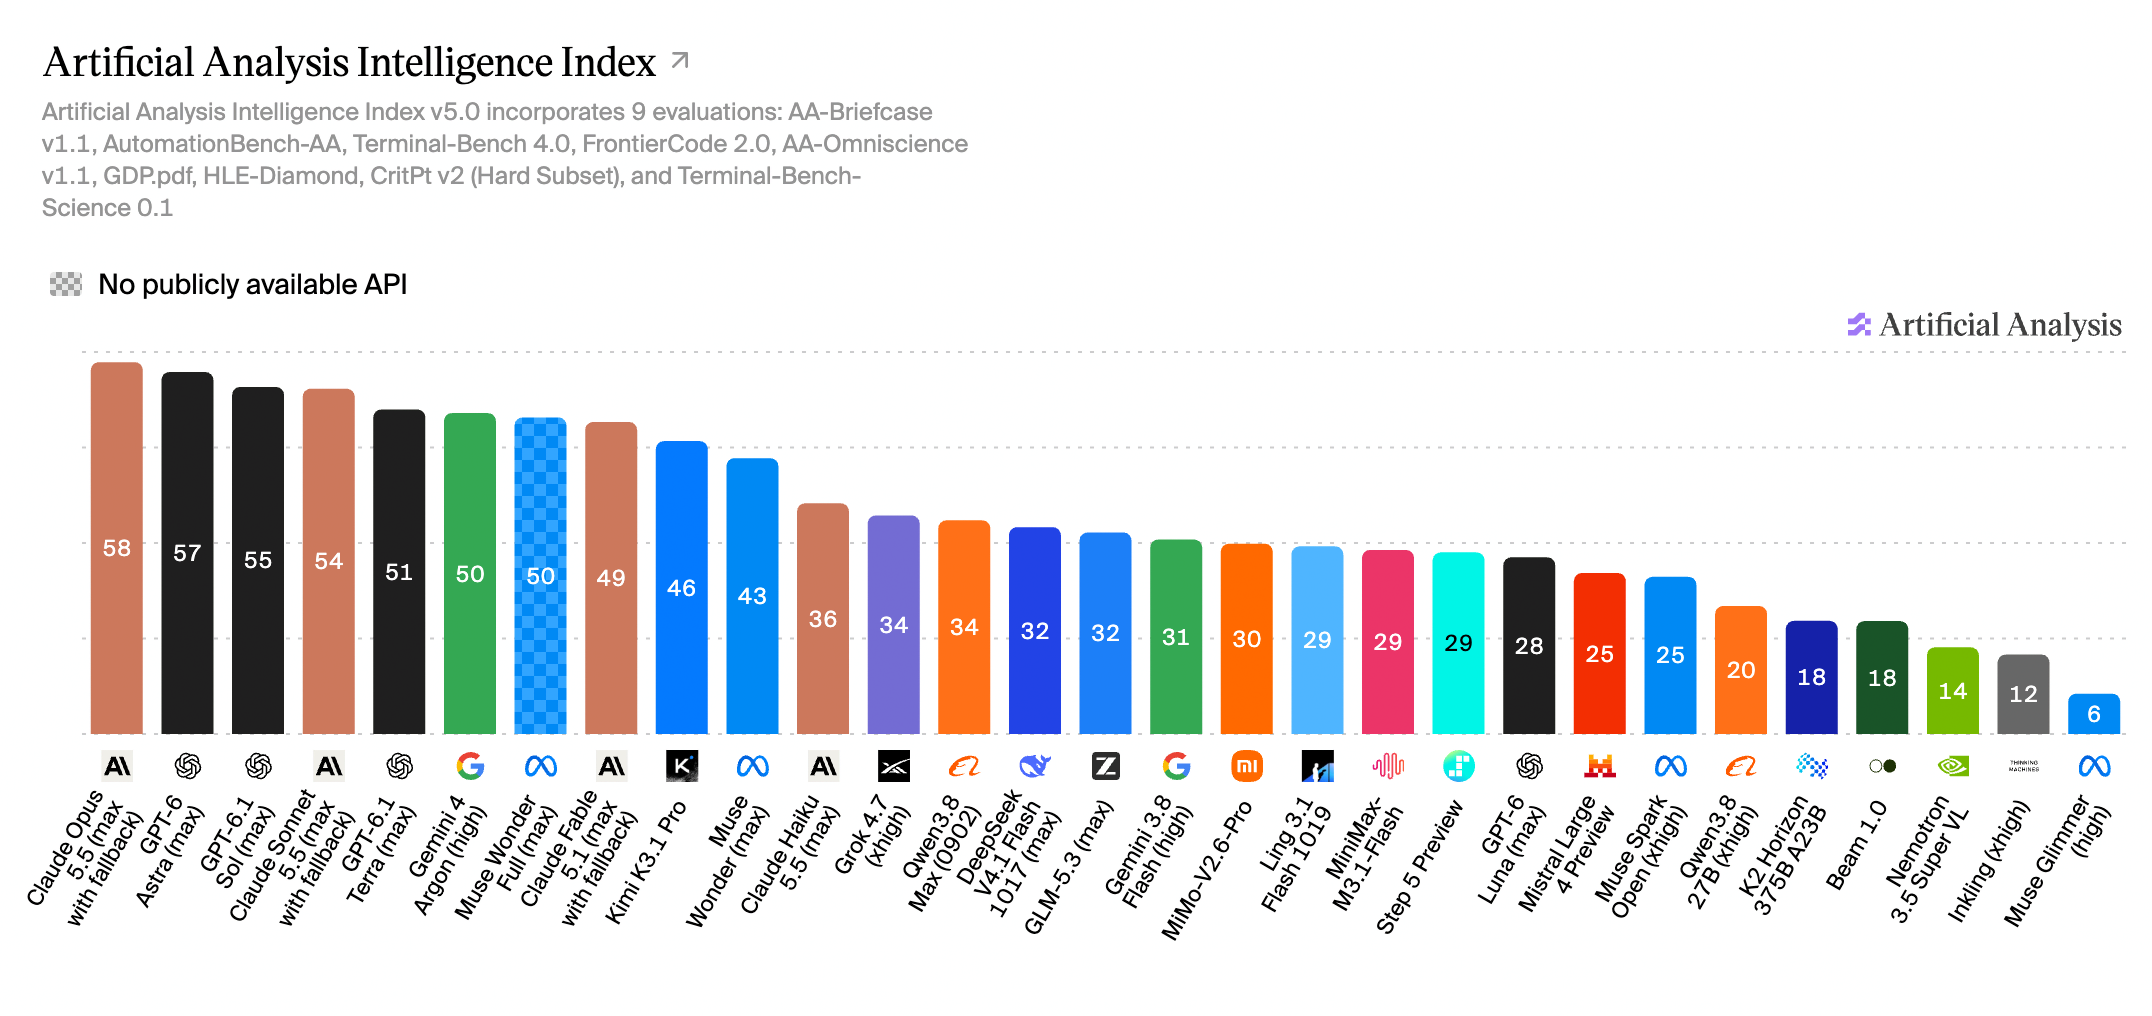
I compared the same ten configurations from the official v5 launch chart with their results in the final archived v4.3.2 leaderboard snapshot. I did not compare September’s model lineup with newer October models.
The positions below are within this selected ten-model group, not ranks across every model on the site. Scores are rounded; tied displayed scores retain source order. The source configurations include effort settings and, for the Anthropic entries, the launch chart’s “max with fallback” configuration.
| Model | v4.3.2 Score | v5 Score | Position Within The Ten |
|---|---|---|---|
| Claude Opus 5.5 | 58 | 58 | 1 → 1 |
| GPT-6 Astra | 53 | 57 | 6 → 2 |
| GPT-6.1 Sol | 52 | 55 | 9 → 3 |
| Claude Sonnet 5.5 | 56 | 54 | 2 → 4 |
| GPT-6.1 Terra | 48 | 51 | 10 → 5 |
| Gemini 4 Argon | 53 | 50 | 7 → 6 |
| Muse Wonder Full | 56 | 50 | 3 → 7 |
| Claude Fable 5.1 | 53 | 49 | 5 → 8 |
| Kimi K3.1 Pro | 55 | 46 | 4 → 9 |
| Muse Wonder | 52 | 43 | 8 → 10 |
Opus stays first. Astra, Sol, and Terra move higher; Kimi moves lower. Models without a matched earlier score are excluded, including the subsequently released Gemini 4 Carbon.
The takeaway is about measurement. These movements do not demonstrate that a model suddenly became better or worse, or that a particular model was contaminated. We cannot allocate each movement among the changed suites, weights, privacy arrangements, and execution conditions using aggregate scores alone.
Why Benchmarks Need To Evolve
Two problems motivate a refresh: benchmark-specific optimization risk and saturation.
A model may improve on a familiar test without equivalent gains on unfamiliar tasks. Contamination is the specific case where test material enters training; overfitting refers to gains that generalize poorly. These should not be treated as interchangeable terms.
Artificial Analysis reports that evaluations with private test sets or held-out answers now contribute 60% of the index, up from 45%. That is a share of index weight, not a count of hidden questions. Private tasks and withheld answers are different mechanisms, and I do not infer their exact split. They are intended to reduce exposure and contamination risk, not guarantee its absence.
Saturation is different: when leading models approach a benchmark’s ceiling, it becomes less useful for distinguishing them. Removing saturated AA-Omniscience questions and using a harder CritPt subset are examples of refreshing the challenge. Harder tests can create more headroom without implying that a lower score means a regression in the model.
Compare Quality And Cost On The Same Workload
Artificial Analysis also reports weighted cost per attempted Intelligence Index task. It combines token spending across the benchmark workload; it is not cost per successful answer or the price of a typical chat request.
The launch examples make the trade-off concrete:
| Model Configuration | Index Score | Cost Per Index Task |
|---|---|---|
| Claude Opus 5.5, max | 58 | $10.04 |
| GPT-6.1 Sol, max | 55 | $1.27 |
| GPT-6.1 Terra, max | 51 | $0.96 |
Sol scores close to Opus at a much lower cost on this workload. Terra costs less than Sol, with a lower benchmark score. These figures help form a shortlist; they do not predict the exact quality or cost of my own application’s requests. The launch article gives the published prices and comparisons.
Why I Would Start With A Quality Floor
Dividing cost by an intelligence score produces a tidy ratio, but it can favor a model that is too weak for the application.
Consider this explicitly hypothetical example:
| Model | Illustrative Score | Cost Per Task | Cost Per Score Point | Meets A Minimum Score Of 57? |
|---|---|---|---|---|
| A | 60 | $10.00 | $0.1667 | Yes |
| B | 58 | $2.00 | $0.0345 | Yes |
| C | 45 | $0.50 | $0.0111 | No |
C wins on cost per point but fails the requirement. B is the cheapest eligible choice: it saves 80% relative to A with a two-point index-score reduction. That arithmetic does not mean the two models differ by a known percentage of useful work—composite index points are not such units.
My proposed approach is to set an acceptable quality level, filter out models below it, and compare the remaining costs. An index-score cutoff only illustrates this idea. The real requirement must be checked on application tasks, including important failures, response time, and total spend.
Lessons Learned
- A ranking is conditional on the measurement. Read the task mix, weights, harness, and grading method before interpreting a change.
- Compare matched configurations. Model names alone can hide differences in effort settings, tools, and execution budgets.
- Privacy reduces risk; it does not prove its absence. A ranking change is not evidence that a vendor trained on the test.
- Set the quality requirement before optimizing cost. Use benchmark results to shortlist candidates, then test them on the work the application actually does.
Summary
Benchmarks need to evolve as models improve. In my view, Intelligence Index v5 is a useful step toward reducing gaming risk and keeping evaluations challenging. Its changed task mix also explains why the same model configurations can receive different scores and rankings. Artificial Analysis helps compare capability, cost, and latency; my impression is that safety and alignment benchmarking still needs to catch up with capability evaluation. That is a broader topic I am exploring in a future post. For model selection today, I would use the index as a starting point and validate quality, cost, and failure behavior on my own tasks.
Explore The Course
For more on building and evaluating agentic applications, including code and hands-on labs, explore Inside AI Agent Systems: From Components to Platforms.
For a limited-time discounted price, use this course coupon link, valid until 7 November 2026.
Acknowledgements
I used Codex to help organize the source material, refine the write-up, and prepare the accompanying animation and video edit.
References
Benchmark Definitions And Results
- Intelligence Index v5 announcement: launch changes, weights, results, and cost examples.
- Intelligence benchmarking methodology: per-benchmark graders, harnesses, and conditions. This is a mutable page; the project source register records the reviewed snapshot.
- Archived October 27 v4.3.2 leaderboard: the historical comparison baseline; the project also preserves a local copy.
- Official v5 launch chart: the selected ten model configurations and their launch scores.
Agent Evaluation
- Coding Agent Index methodology: agent-product evaluation and the specifically documented integrity-review use of Harbor.
- Stirrup: Artificial Analysis’s agent framework.